Day trading is a thrilling yet challenging endeavor that demands precision, strategy, and a deep understanding of market dynamics. Traders often rely on the best technical indicators for day trading to analyze price movements and identify potential entry and exit points. In this article, we delve into the world of day trading and explore some of the best technical indicators for day trading that can enhance your trading performance and increase your chances of success.
Understanding Day Trading:
Day trading involves buying and selling financial instruments within the same trading day, aiming to profit from short-term price movements. Unlike long-term investing, day traders capitalize on volatility and intraday price fluctuations to generate profits. Success in day trading requires a combination of technical analysis, risk management, and disciplined execution.
Best Technical Indicators for Day Trading:
Technical indicators are mathematical calculations based on historical price, volume, or open interest data. These indicators help traders analyze market trends, identify potential reversals, and generate buy or sell signals. While there are numerous best technical indicators for day trading available, not all are equally effective for day trading. Traders must select indicators that align with their trading style, timeframes, and risk tolerance.
The Best Technical Indicators for Day Trading:

1.Moving Averages:
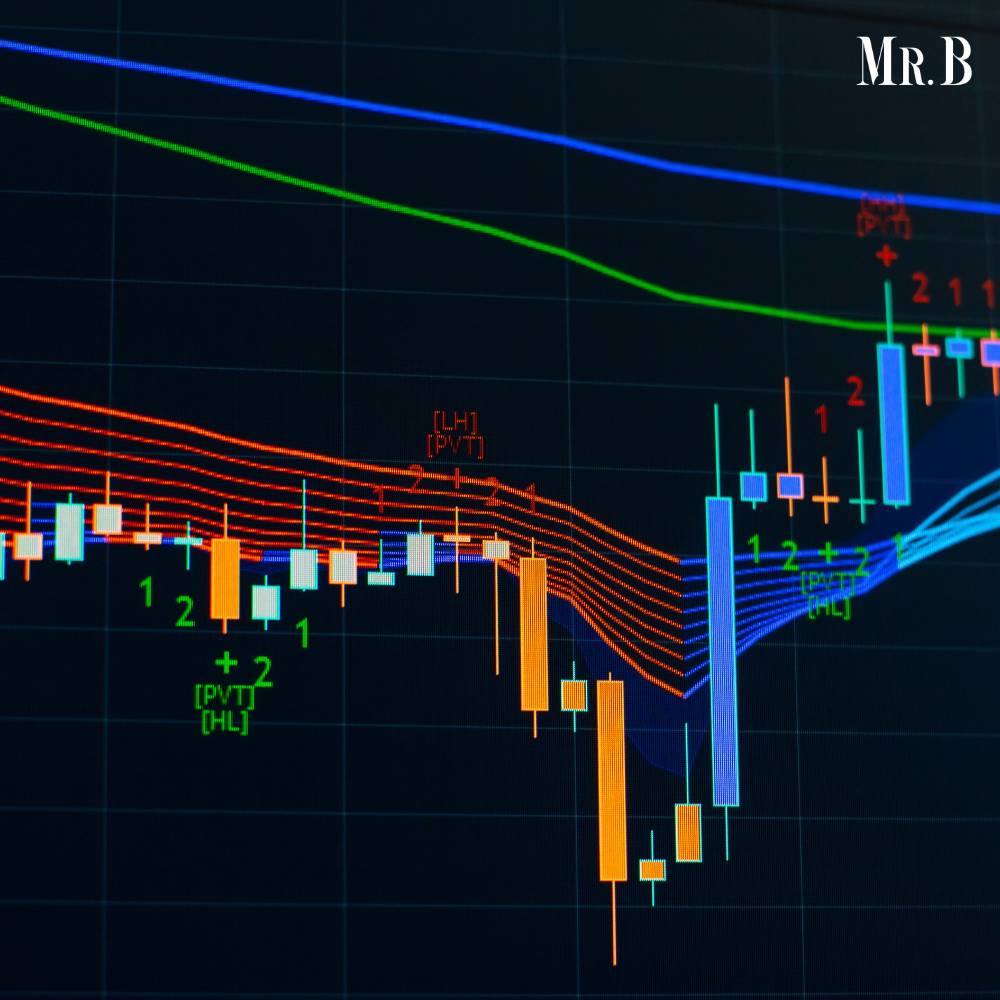
Moving averages are fundamental best technical indicators for day trading that smooth out price data, providing a clearer view of the underlying trend. Popular moving averages include the simple moving average (SMA) and the exponential moving average (EMA). Day traders often use shorter-term moving averages (such as the 9-period or 20-period) to identify short-term trends and potential entry points. Moving average crossovers, where a short-term moving average crosses above or below a longer-term moving average, can signal bullish or bearish momentum shifts.
2.Relative Strength Index (RSI):
The Relative Strength Index (RSI) is a momentum oscillator that measures the speed and change of price movements. RSI values range from 0 to 100, with readings above 70 indicating overbought conditions and readings below 30 indicating oversold conditions. Day traders use RSI to identify potential reversal points and confirm the strength of a trend. Combining RSI signals with price action analysis can enhance trading decisions and reduce false signals.
3.Bollinger Bands:
Bollinger Bands consist of a simple moving average (typically 20 periods) and upper and lower bands that represent volatility levels. The bands expand and contract based on market volatility, providing visual cues for potential price breakouts or reversals. Day traders often look for price action near the outer bands, as prices trading outside the bands may signal overbought or oversold conditions. Bollinger Band squeezes, where the bands converge due to low volatility, can precede significant price movements, offering trading opportunities.
4.Volume Profile:
Volume Profile is a technical indicator that displays trading volume at specific price levels over a specified period. It helps traders identify price levels where significant buying or selling activity has occurred. Day traders use volume profile to spot areas of high liquidity, support, and resistance. Price reactions at volume profile levels, such as price consolidations or rapid price movements, can provide valuable insights for trade entries and exits.

5.MACD (Moving Average Convergence Divergence):
The Moving Average Convergence Divergence (MACD) is a trend-following momentum indicator that consists of two lines: the MACD line and the signal line. MACD crossovers and divergences between the MACD line and price can signal potential trend changes and momentum shifts. Day traders use MACD to confirm trend direction, identify entry points during pullbacks, and avoid trading against the prevailing trend. Combining MACD signals with other best technical indicators for day trading strengthens trading strategies.
6.Fibonacci Retracement Levels:
Fibonacci retracement levels are based on Fibonacci ratios and are used to identify potential support and resistance levels in a price trend. Key Fibonacci levels include 23.6%, 38.2%, 50%, 61.8%, and 100%. Day traders apply Fibonacci retracements to identify price levels where corrections or reversals are likely to occur. Trading opportunities arise when Fibonacci levels align with other best technical indicators for day trading or significant price patterns, increasing the probability of successful trades.
7.Average True Range (ATR):
The Average True Range (ATR) measures market volatility by calculating the average range between high and low prices over a specified period. ATR values reflect volatility levels, helping traders adjust position sizes and set stop-loss levels based on market conditions. Day traders use ATR to gauge potential price movements and avoid placing trades during periods of low volatility. Volatility expansions identified by ATR can signal breakout opportunities or trend accelerations.
8.Stochastic Oscillator:
The Stochastic Oscillator is a momentum indicator that compares a security’s closing price to its price range over a specified period. It consists of two lines (%K and %D) that oscillate between 0 and 100. Stochastic readings above 80 indicate overbought conditions, while readings below 20 indicate oversold conditions. Day traders use Stochastic signals to identify potential reversals at extreme levels and confirm trend strength. Combining Stochastic signals with other technical tools enhances trading accuracy.

9.Ichimoku Cloud:
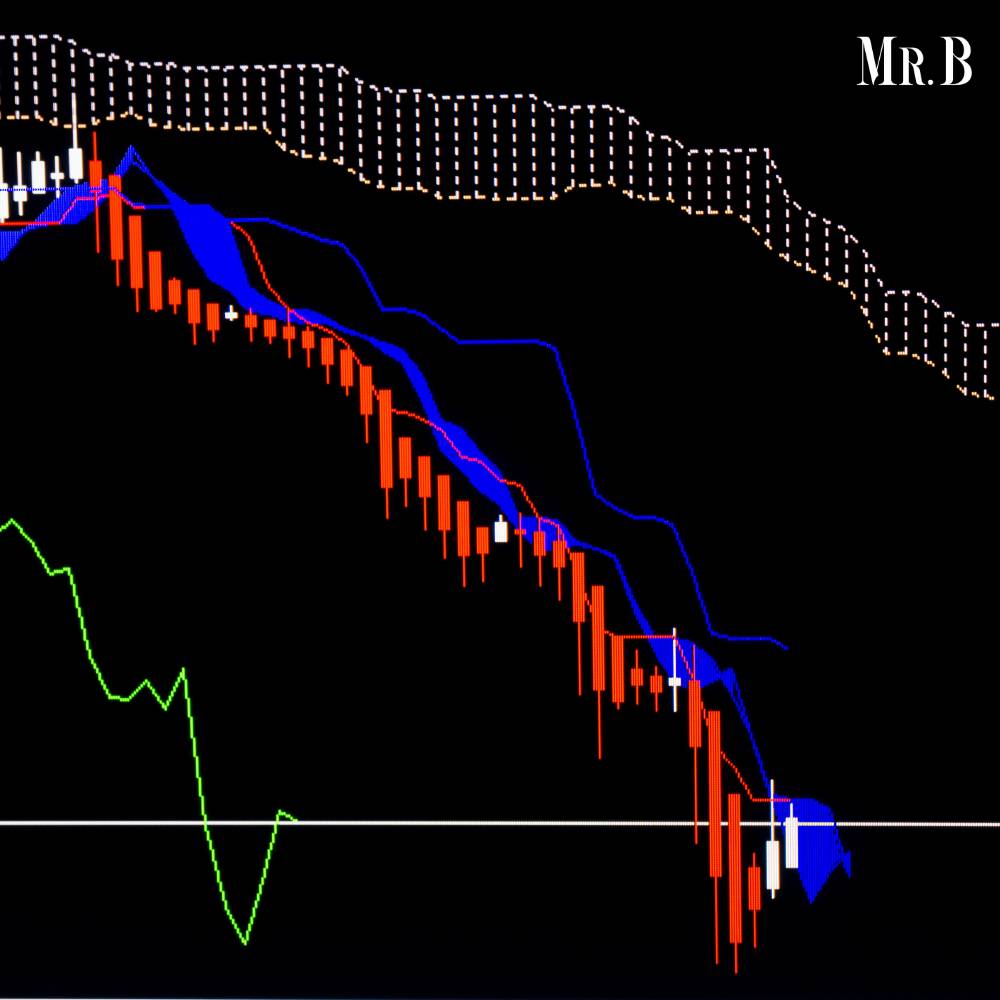
The Ichimoku Cloud is a comprehensive technical indicator that provides insights into trend direction, support and resistance levels, and potential trend reversals. It consists of several components, including the Kumo (cloud), Tenkan-sen (conversion line), Kijun-sen (baseline), and Chikou span (lagging line). Day traders use the Ichimoku Cloud to assess overall market conditions, identify trend continuations or reversals, and determine optimal entry and exit points. Clear signals from the Ichimoku components enhance trading precision.
10.Volume Oscillator:
The Volume Oscillator measures the difference between two volume moving averages to analyze volume trends. Positive values indicate increasing volume, while negative values indicate decreasing volume. Day traders use the Volume Oscillator to confirm price trends based on volume participation. Volume spikes or divergences with price movements can provide valuable insights into market sentiment and potential trend reversals.
Conclusion:
Day trading requires a combination of skill, discipline, and effective use of technical indicators to navigate volatile markets successfully. While the best technical indicators for day trading may vary based on individual preferences and trading strategies, incorporating a combination of indicators such as moving averages, RSI, Bollinger Bands, volume profile, MACD, Fibonacci levels, ATR, Stochastic Oscillator, Ichimoku Cloud, and Volume Oscillator can enhance trading decisions and improve overall profitability. Traders should focus on understanding each indicator’s strengths and limitations and integrate them into a cohesive trading strategy with proper risk management practices. Continuous learning, practice, and adaptability are key to mastering day trading and achieving consistent success in dynamic financial markets.
Curious to learn more? Explore this Article on: Mr. Business Magazine


